
温室气体排放核算
-

Maritime Freight Carbon Emission in the U.S. using AIS data from 2018 to 2022
Global maritime emissions, a 3% contributor to greenhouse gases, anticipate a surge of 90–130% by 2050. Regulatory challenges persist due to international governance gaps. Legislative strides, including the EU Emission Trading System, highlight global efforts. In the U.S., despite legislative commitment, consensus hurdles impede cross-regional carbon management. Prevailing top-down emissions estimation methods warrant scrutiny. This paper unveils U.S. maritime emissions intricacies, focusing on carbon accounting, transfer, and compensation for cargo and tanker vessels. Leveraging AIS data (2018–2022), an activity-based/bottom-up approach navigates emissions calculations, aiming to reshape understanding and foster strategic reductions. The study bridges gaps in U.S. maritime emission research, promising insights into transfer and compensation dynamics. By concentrating on high-impact vessel types, it contributes to emissions mitigation strategies, steering towards a sustainable U.S. maritime future.
-

Aviation carbon transfer and compensation of international routes in Africa from 2019 to 2021
As an underdeveloped region, the aviation industry in Africa is developing rapidly, and its carbon emissions play an essential role in achieving carbon neutrality in the aviation industry in underdeveloped areas. However, the problem of carbon transfer caused by passenger flow on international routes has not been addressed, especially in Africa. This paper first calculates the CO2 emissions of African international routes from 2019 to 2021 based on the Modified Fuel Percentage Method (MFPM) and the ICAO standard methods. Then, we measure African routes' carbon transfer and carbon compensation. The most carbon transfer routes between African countries and from countries outside Africa to African countries are from Ethiopia to Kenya and from Honduras to Ghana. Relatively poor countries bear a significant amount of carbon transfer.
-

Potential carbon emissions reduction from fleet schedule reconfiguration of China’s and India’s external routes
This article calculates the carbon emissions from China-foreign and India-foreign routes in 2019. The error rate of China’s and India’s external routes is about 2.75% and 5.21%, respectively. First, it obtains the aircraft with the least emission intensity in each distance segment. Then, we use the aircraft with the lowest emission intensity to replace the original aircraft and compare the emission reduction. The results show that after the aircraft is reconfigured, the CO2 of China-foreign and India-foreign routes has declined by 57.08% and 35.45%, respectively. Interestingly, the average aircraft costs of China-foreign and India-foreign routes also dropped 8.04% and 39.39%, respectively, after the reconfiguration. Therefore, fleet schedule reconfiguration is one of the most feasible ways for airlines to reduce emissions. However, for airlines with increased average aircraft costs, only when the carbon price is eight times the current level can they offset the increase in the average aircraft costs.
-
Impacts of the proposal of the CNG2020 strategy on aircraft emissions of China–foreign routes
Aviation emission accounting is the key to establishing market measures to control aviation pollutant emissions. Based on the fuel percentage method (FPM), this paper applies the improved BFFM2-FOA-FPM (Boeing Fuel Flow Method 2–First Order Approximation FPM) to calculate the emissions of six pollutants (CO2, CO, HC, NOx, SO2, and PM2.5) between Chinese and foreign cities from 2014 to 2019, including CCD (climbing, cruising, and descending) emissions and LTO (landing and take-off) emissions. The error rate between the calculated results and the official data is about 2.75?%. The results show that the emissions of six pollutants changed before and after the proposal of the “Carbon Neutral Growth 2020” strategy (CNG2020 strategy). Although the total amount has increased, the average emission per tonne-kilometer of CO2, CO, HC, NOx, SO2, and PM2.5 has decreased by 17.77?%, 17.26?%, 25.15?%, 14.32?%, 17.77?%, and 16.35?%, respectively. The results of this paper can provide a data basis and method reference for implementing the CNG2020 strategy and realizing global carbon emission reduction goals. The dataset is available from https://doi.org/10.6084/m9.figshare.20071751.v1 (Cui., 2022).
-
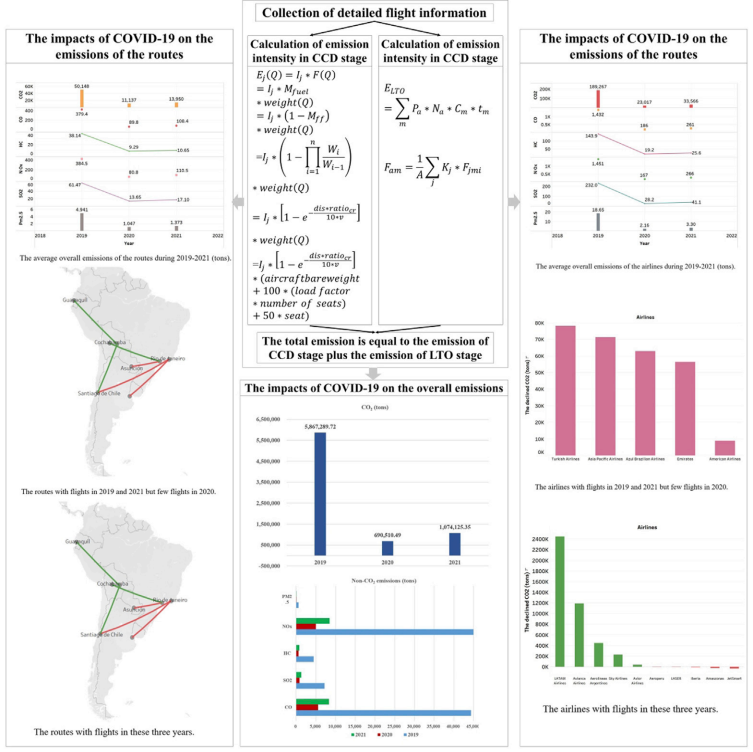
Impacts of the COVID-19 on all aircraft emissions of international routes in South America
The COVID-19 pandemic has had a significant impact on South America’s economic development, as well as its international civil aviation industry. This paper seeks to calculate the emissions of six pollutions (CO2, CO, HC, NOx, SO2, and PM2.5) from the international routes in South America during 2019–2021 and discusses the impacts of COVID-19 on the emission change. The modified BFFM2-FOA-FPM method is proposed to unify the CO2 and non-CO2 calculations. The calculated results' average error rate is about 5.12%. The results showed that COVID-19 affected all emissions, including the number of routes, average flight distance, aircraft configuration, the proportion of CCD phase emissions, average emissions, etc. In addition, some airlines increased the number of flights and aircraft types during the pandemic, increasing emissions. The results give a reasonable data basis for the aviation industry in South America to formulate emission reduction policies.
-
Accounting for the aircraft emissions of China’s domestic routes during 2014–2019
The “13th Five-Year Plan” of civil aviation energy conservation and emission reduction impacts China’s domestic aviation exchanges. However, few researchers pay attrition to the impact of the 13th Five-Year Plan on aviation emissions. This paper intends to calculate the emissions of six pollutants (CO2, CO, HC, NOx, PM2.5, and SO2) in China’s domestic airlines from 2014 to 2019 and explore the impact of the 13th Five-Year Plan on emissions changes. In this paper, the improved BFFM2-FOA-FPM method is used to unify the calculation of CO2 and other aviation emissions. The error rate between the estimate and the official data was about 6.45%. The results show that the 13th Five-Year Plan has impacted on aviation emissions, including the number of routes and airlines, aircraft configuration, air routes, and airline unit turnover emissions. Additionally, the 13th Five-Year Plan’s effect is not significant, and it does not promote the reduction of emissions on domestic routes.
-

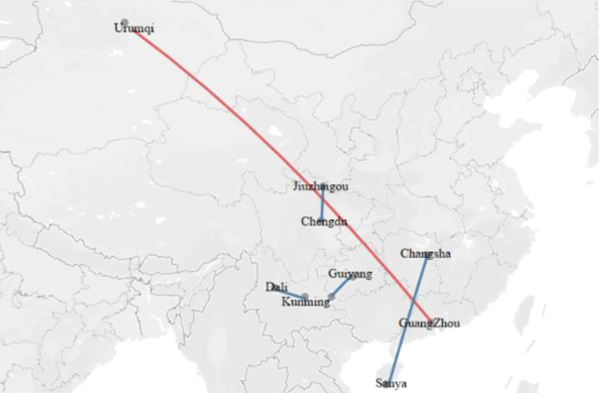
Accounting for the carbon emissions from domestic air routes in China
This study seeks to build a database of China's 413 main routes in 2018, which contains the carbon emission intensity of the leading aircraft types, the Climb/Cruise/Descent (CCD) carbon emissions of each airline and each route, and the probable emissions when the routes are straight. First, the Modified Fuel Percentage Method (MFPM) is applied to calculate the carbon emission intensity of main aircraft types at various distances. Next, the carbon emissions and the Revenue Passenger Kilometers of 413 routes and 40 airlines are calculated. Dali-Kunming and Joy Air have the most significant emission intensity among the routes and airlines. However, the excess emissions of the non-straight routes account for about 10.15% of the actual emissions.